Vol. 1, Núm. 2 (2026): julio
DOI: 10.63957/arksis.v1i2.0011
ISSN: 3121-2883
Artículo de Investigación
Recibido: 17, junio 2026 Aceptado: 22, junio 2026 Publicado: 31, julio 2026 Como citar: J. Garcia Abata, F. Bonilla-Guerrero, and R. Nogales, “Vehicle monitoring system for automobiles through license plate character recognition and sanction assessment using Mamdani fuzzy logic”, ARKSIS-Journal, vol. 1, no. 2, pp. 1–18, Jul. 2026, doi: 10.63957/arksis.v1i2.0011.
Vehicle monitoring system for automobiles through license plate character recognition and sanction assessment using Mamdani fuzzy
Sistema de monitoreo vehicular para automóviles mediante reconocimiento de caracteres en placas y evaluación de sanciones con lógica difusa Mamdani
Creative Commons CC BY 4.0
Fernando Bonilla-Guerreroa,
Josué García-Abataa,
Ruben Nogalesa aFacultad de Ingeniería en Sistemas, Electrónica e Industrial, Universidad Técnica de Ambato, Ambato 180150, Ecuador. Autor de correspondencia: josuegarcab2@gmail.com
Resumen:
En recintos institucionales, identificar los vehículos y revisar su velocidad suele realizarse de forma manual, lo cual es lento y propenso a errores. Se desarrolló un sistema de visión computacional que integra el proceso en un solo flujo: la placa se detecta con YOLOv11n, los caracteres se segmentan con una U-Net y se clasifican con una CNN, se comprueba el formato de placa ecuatoriana, se estima la velocidad con dos líneas virtuales y un sistema difuso Mamdani pondera el exceso de velocidad y la reincidencia para sugerir una sanción gradual e interpretable. El clasificador alcanzó 91.42% de exactitud sobre un conjunto de prueba de 5877 recortes y, en 74 vehículos reales, la placa completa se leyó correctamente con 94.59% de exactitud. La integración de estas etapas es viable y apoya al operador sin reemplazar su criterio. Palabras Clave: Visión computacional; reconocimiento de placas; lógica difusa Mamdani; aprendizaje profundo; apoyo a la decisión.
Abstract:
Identifying vehicles and checking their speed on institutional grounds is usually performed manually, which is slow and prone to error. A computer vision system was developed to integrate the whole process in a single pipeline: the plate is detected with YOLOv11n, the characters are segmented with a U-Net and classified with a CNN, the result is validated against the Ecuadorian plate format, the speed is estimated from two virtual lines, and a Mamdani fuzzy system weighs speeding and repeat offenses to suggest a gradual, interpretable penalty. The classifier reached 91.42% accuracy on a test set of 5877 crops, and on 74 real vehicles the full plate was read correctly with 94.59% accuracy. Integrating these stages is feasible and supports the operator without replacing their judgment. Keywords: Computer vision; license plate recognition; Mamdani fuzzy logic; deep learning; decision support
1 Introducción
Identifying which vehicles are entering a closed site, and tracking what is happening there, has become important for the safety and orderly movement of institutional settings. It is useful to know which vehicle enters, to check its speed, and to keep a clear record so incidents can be prevented and traced. Computer vision has been playing a growing role in intelligent transportation systems, since a camera is observing the traffic continuously and extracts structured information from the video [1]. When plate recording and speed checking have depended on a manual operator, the process has been slow, subjective, and prone to errors, which has motivated automated tools that are supporting the decision with objective data.
Automatic license plate recognition (ALPR) has been widely studied with computer vision and deep learning. Many systems have combined locating the vehicle and its plate with reading its content, aiming to operate in real conditions, where lighting, angle, distance to the plate, and image quality have affected performance [2]. Still, even multi-step proposals have focused mainly on finding the plate and reading its characters; and although some have linked this with dashboards that are monitoring parking, occupancy, or vehicle movement, they have not included speed estimation tied to the recognized plate [3].
From a technical standpoint, these stages have usually been studied independently. Detection has relied on fast, single-pass YOLO models, and recent versions such as YOLOv11 have been locating plates in real time [4]; character segmentation has used encoder-decoder networks like U-Net, which have kept the fine details needed to isolate small or worn characters [5]; and character classification has used convolutional neural networks (CNN) [6], or coupled an OCR tool to the detector [7]. In parallel, speed has been estimated from video by measuring the time a vehicle has taken to travel between known references [8]. Each part offers a solid foundation, but they are rarely integrated into a single flow.
Once the plate, the speed, and the history are available, another problem has appeared: a penalty is not a binary decision, but a graded judgment that should remain interpretable. Mamdani fuzzy logic is well suited to this, because it has been describing values with linguistic terms and If-Then rules and has given the operator a readable output, and it has been used in road traffic where the interpretability of the variables is relevant [9]. In this system the inference has been combining the speeding with the number of prior offenses of the same plate, taken from an internal database, not from official records; adding the history this way has agreed with studies that have linked past violations to a higher risk of reoffending and crashes [10].
Two complementary gaps thus emerge. First, detection, segmentation, classification, and speed have usually been studied separately. Second, the systems that have joined several of these steps have stopped once they have the plate, without linking it to the speed or the vehicle's prior behavior. As a result, no proposal has brought together, in a single working flow, the reading of the plate characters, the speed, the check for repeat offenses in an internal database, and a clear suggested penalty. This integrated pipeline, from visual perception to decision support, is the gap this work has aimed to fill.
To close that gap, this study has developed and evaluated a computer vision system that is reading the characters on a license plate and is suggesting a penalty with Mamdani fuzzy logic. In a single flow it integrates plate detection with YOLOv11n, character segmentation with U-Net, classification with a CNN, a check of the Ecuadorian plate format, speed estimation with virtual lines, and a Mamdani system that has weighed the speeding together with the repeat offenses stored in the internal database. The assumption has been that joining these steps makes it possible to read the plate and produce clear, graded penalties as objective support, without replacing the operator's final judgment.
The materials and methods section describes the datasets, the detection, segmentation, and classification models, the plate-format check, the speed estimation, the fuzzy system, the monitoring app, and how everything has been tested. The results report how each part and the whole system performed on real vehicles, and the discussion and conclusions interpret them and outline the contribution and the future work.
2. Materials and Methods
2.1. Materials
This section lists the resources used to build and test the system: how the video has been captured, the test videos, the computer that ran everything, and the datasets used to train and check the detection, segmentation, and classification models.
Video acquisition setup
To capture video in real time, a POCO X7 phone has been connected to a laptop with a USB cable, and the laptop has performed the processing. Using the cable instead of a wireless network has made the link more stable. The video has been read with Camo Studio 2.7.2, which exposes the phone's rear camera to the app, with the stream running at 1920 x 1080 px and 60 fps. This has kept enough resolution over the plate and has provided several frames as the vehicle crosses, which matters in video-based ALPR, where image quality, plate size in pixels, and the number of frames all affect its real-time reading reliability [2].
Video sources and test scenarios
The system has been tested with two video sources: a recording and a live capture. The recording has served as a controlled scenario to check the framing, the input resolution, the measurement zone, and a first plate reading before real-time operation. The live capture has used the POCO X7 over USB, as in Section 2.1.1, to evaluate how the modules handle a continuous input: frame acquisition, plate reading, and overall response. This step matters because video-based ALPR must operate with moving vehicles, where the plate size, image quality, lighting, and number of frames all affect real-time reading reliability [2].
Processing environment
The laptop has served as the local processing environment: it has received the video, has run the detection and classification models, and has integrated plate recognition, speed estimation, and the later analysis. Even though it is an ordinary laptop with a graphics card, it has handled the whole flow locally, consistent with ALPR studies that have used lightweight detection models to work in real time on devices with limited resources [11]. Its specifications are in Table 1.
Table 1. Specifications of the processing environment used in the system.
Microsoft Windows 11 Home, versión 10.0.26200, build 26200
The system has been implemented in Python (3.10.11). The main libraries have been Ultralytics (8.4.56) for the YOLO detection, PyTorch (2.5.1+cu121) and TensorFlow/Keras (2.10.1) for segmentation and classification, OpenCV (4.8.1.78) for frame capture and preprocessing, and NumPy (1.23.5) with scikit-learn (1.3.2) for the calculations and the evaluation.
Datasets for training and evaluation
Besides the videos used to test the system, specific datasets have been used to train and evaluate the plate detection, character segmentation, and character classification models.
Plate detection dataset. For the detector a public dataset has been used from Roboflow Universe, with a single class, License_Plate, under a CC BY 4.0 license [12]. It was chosen for its size and because its labels already come in YOLOv11 format, which is directly compatible with the fast, single-pass detectors that have given good results when locating plates [4]. It has been split into training, validation, and test (Table 2), and the training part includes augmentation, which explains its larger size.
Table 2. Dataset used for plate detection.
Partition
Number of Images
Training
98798
Validation
2048
Test
1020
Total
101866
Character segmentation dataset. For segmentation public license plate datasets from different countries have been used: India [13], Brazil [14] and the United Kingdom [15], plus a small set of real crops from Ecuador [16] to increase visual variability. All of them are shared under a CC BY 4.0 license. Table 3 details their split into training, validation, and test.
Table 3. Datasets used for character segmentation.
Dataset
Training
Validation
Test
India
2385
344
-
Ecuador
22
-
-
Brasil
5406
-
33
Reino Unido
3000
-
764
Total
10813
344
797
Character classification dataset. For classification public datasets of plate characters have been used from the United Kingdom [15] and Brazil [14], which provide individual crops already labeled by class. Table 4 shows their split into training, validation, and test.
Table 4. Dataset used for character classification.
Partition
United Kingdom
Brazil
Total
Training
50534
36708
87242
Validation
11829
4290
16119
Test
5680
197
5877
Total
68043
41195
109238
3. Methods
This has been applied, experimental, quantitative work aimed at designing and testing a computer vision system for the detection and recognition of vehicle license plates. The evaluation has been carried out in real traffic, analyzing both the individual models and the integrated system.
General system flow
The system runs frame by frame, chaining the visual steps with a fuzzy-logic decision module. A YOLOv11n detector locates the plate; on the crop, a U-Net segments the character pixels, which are split into boxes and classified by a CNN as letters or digits. The result is checked against the Ecuadorian format (three letters and three or four digits) to drop incomplete readings. At the same time, the speed module measures the time the vehicle takes to cross two virtual lines to estimate its speed. Finally, the plate is used to query repeat offenses, and the Mamdani system combines the speeding and the history into a severity score and a suggested penalty.
Spatial and temporal sampling criteria
The accuracy with which the system reads the plate and estimates the speed depends not just on the models but on how the camera samples the scene in space and time. In space, ALPR systems need about 100 to 150 pixels across the width of the plate to resolve the letters and digits reliably [17]. To determine whether a scene reaches this threshold, the pixels per meter (PPM) has been used, a measure taken from video-surveillance design guides that relates the required detail to the available resolution and the real width the camera covers [18]. It has been found by dividing the horizontal resolution of the stream by the real visible width of the scene:
$$ p=\frac{N_h}{W} $$
(1)
where p is the pixels per meter (PPM), \(N_h\) is the horizontal resolution of the stream (in pixels) and W is the real visible width of the scene (in meters). In time, the more frames recorded while the vehicle crosses each line, the more precisely the entry and exit instants can be located, which are the ones used to compute the speed [8]. By the Nyquist-Shannon sampling theorem [19], the sampling rate must be at least twice the frequency of the phenomenon to be captured to avoid aliasing, so the capture was set to 60 fps instead of the usual 30, doubling the samples during the crossing. Not every captured frame is processed, since that depends on the software speed, the computer, and the input resolution [2].
Plate detection with YOLO
The plate has been located with a YOLOv11n model trained on a single class, License_Plate. YOLO has been chosen because it is a single-pass model suitable for real-time operation and has given good results on license plates [4], and the nano version because it is the lightest and the most suitable for devices with limited resources [11]. Table 5 lists the training parameters.
Table 5. Training parameters of the YOLOv11n plate detector.
Parámetro
Valor
Architecture
YOLOv11n
Task
Object detection
Class
License_Plate
Number of classes
1
Epochs
10
Input size
416 px
Pretrained weights
No
Batch
Automatic
Optimizer
Automatic
Total available
101 866
For inference, a 416 px input has been used, matching the dataset images, and a confidence threshold of 0.25. When several detections occurred, the box with the highest confidence was kept, and a 0.08 margin was added to preserve visual context before straightening, segmentation, and classification. The threshold and margin have been established experimentally.
Character segmentation with U-Net
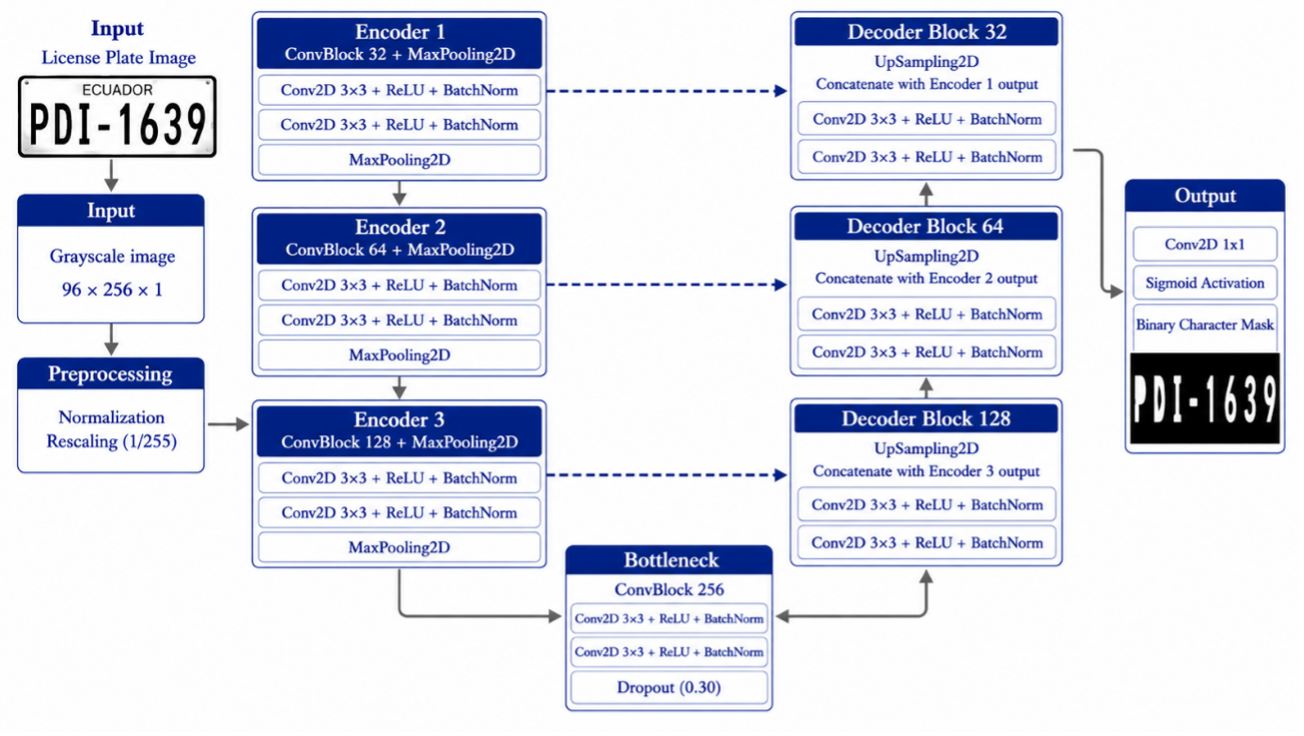
For character segmentation a U-Net has been used to identify the character regions in the plate crop. It has been chosen because its encoder and decoder, joined by skip connections, keep the fine detail while rebuilding the mask, which helps with thin strokes and closely spaced characters [20], and because it has been used before to read license plates [5]. The input has been a grayscale plate image of 96 x 256 x 1 pixels with rescaled intensities, and the output has been a mask giving each pixel's probability of belonging to a character region. The U-Net does not classify letters or digits; it only separates the character regions from the background.
Figure 1. Proposed U-Net architecture for character segmentation.
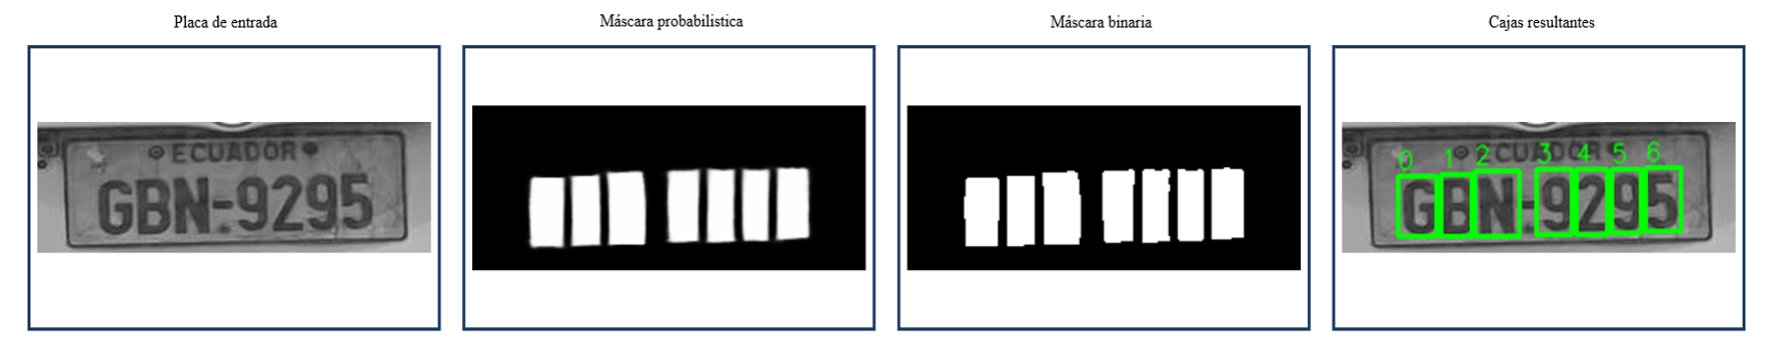
As shown in Figure 1, the network consists of an encoder and a decoder. The encoder has used convolutional blocks of 32, 64, and 128 filters with MaxPooling for spatial reduction; a 256-filter block forms the central part, and the decoder recovers the resolution with UpSampling and by joining the encoder outputs. A 1 x 1 convolution with sigmoid has given the output mask in the range [0, 1], binarized with a threshold set by testing at 0.50 to separate character pixels from the background. From this mask, contours are extracted and a bounding box is generated around each character, giving one crop per character for the classifier as illustrated in Figure 2.
Figure 2. Real example of the U-Net output and transformation of the mask into character boxes.
The training configuration used for the U-Net is summarized in 6.
Table 6. Training parameters of the segmentation U-Net.
Parameter
Value
Optimizer
Adam
Loss function
Weighted binary cross-entropy + Dice
Batch size
16
Epochs
50
Alphanumeric classification with CNN.
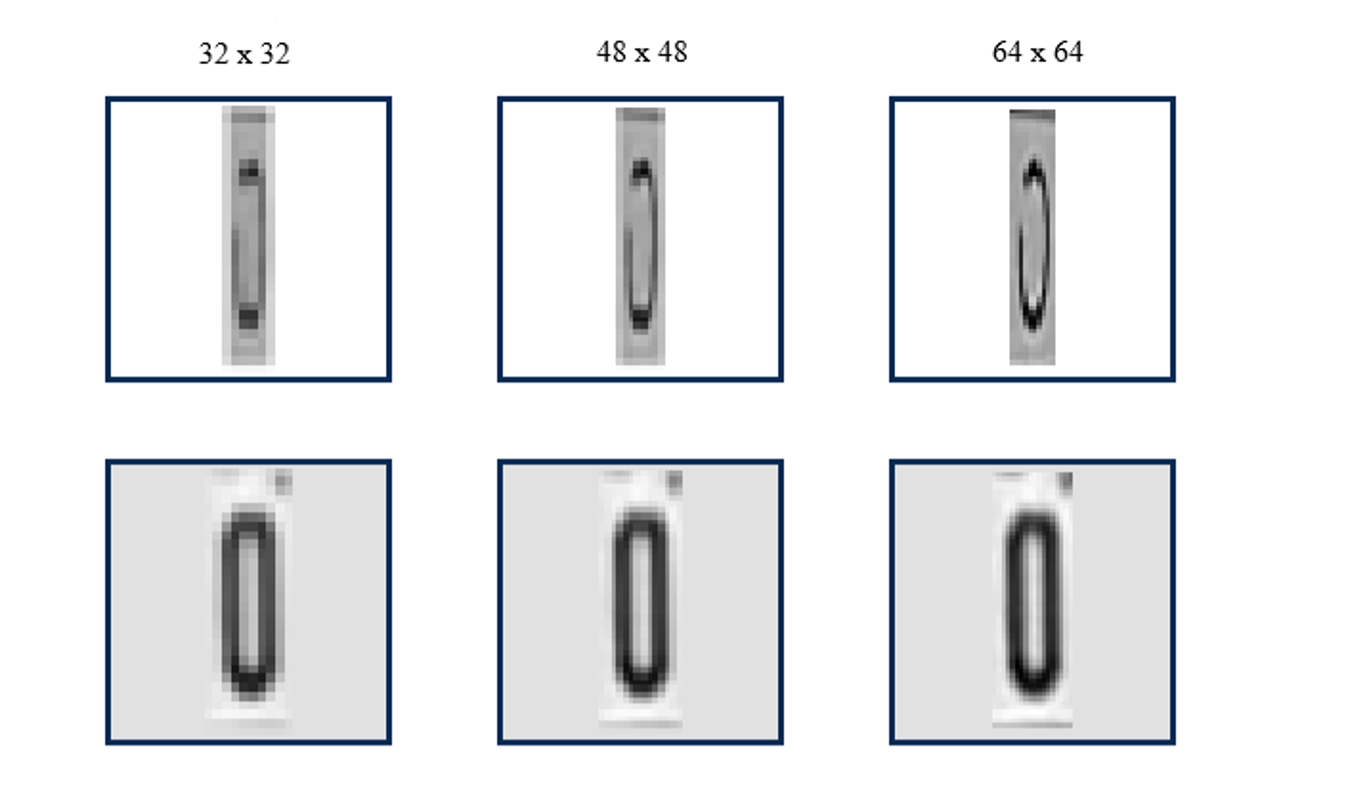
For classification a CNN has been used on each crop from the segmentation step. Every crop is a possible plate character, handled as a grayscale image and given one of 36 classes (digits 0 to 9, letters A to Z). A CNN has been chosen because it learns visual features directly from the pixels and has reached low error rates on plate characters [6]. Each image has been resized to 64 x 64 x 1 pixels with rescaled intensities. That size keeps the edges, curves, and gaps needed to distinguish visually similar characters such as O and 0, B and 8, or I and 1 (Figure 3): in an experimental comparison, 32 x 32 and 48 x 48 lost detail and led to misclassification, while 64 x 64 retained enough detail for reliable classification.
Figure 3. Comparison of a character at 32 × 32, 48 × 48, and 64 × 64.
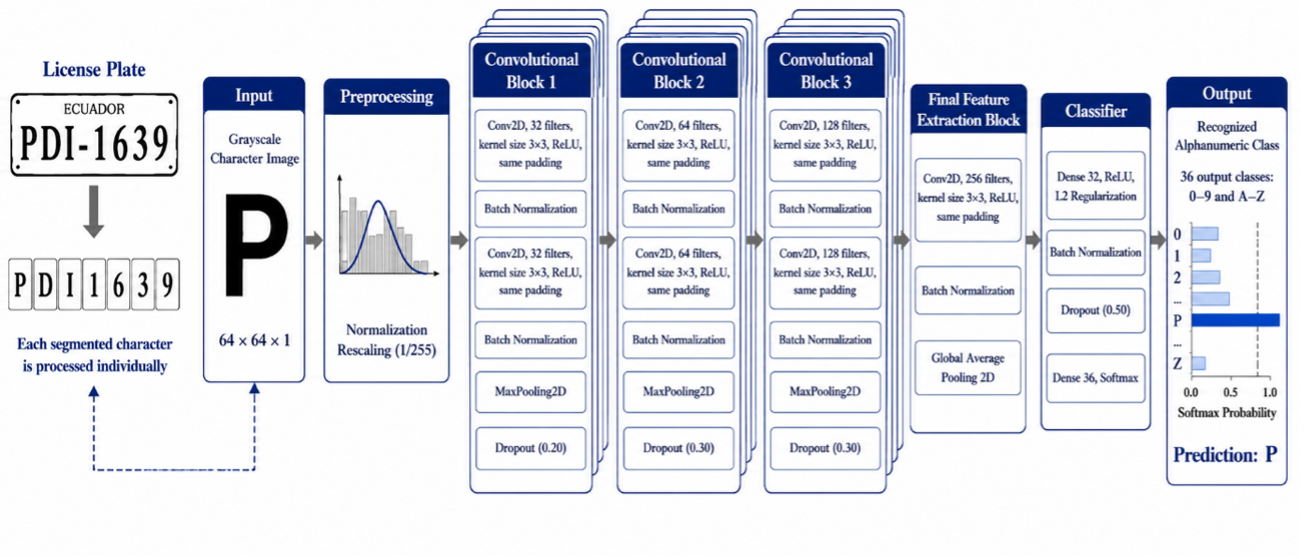
With the 64 x 64 x 1 input set, the classifier follows a progressive convolutional design, shown in Figure 4.
Figure 4. Proposed CNN architecture for character recognition.
The network consists of three convolutional blocks of 32, 64, and 128 filters, plus a final 256-filter Conv2D. Each block has stacked Conv2D layers (3 × 3 kernel, ReLU), Batch Normalization, MaxPooling, and Dropout, so early layers capture simple strokes and later ones more complex shapes. The filters have doubled (32, 64, 128, 256) as the spatial resolution decreases, following the stacked 3 × 3 blocks of VGG-type networks [21]. Dropout has reduced overfitting [22], with rates that grow (0.20, 0.30, 0.35, 0.50) set by testing. Instead of a flatten, GlobalAveragePooling2D has reduced the parameters before a dense layer (ReLU, L2, Batch Normalization) and an output layer of 36 units with softmax. Table 7 summarizes the architecture.
Table 7. Architecture of the CNN character classifier.
The training configuration used for the classifier is summarized in Table 8.
Table 8. Training parameters of the CNN classifier.
Parameter
Value
Optimizer
Adam
Learning rate
0.001
Loss function
Focal loss: 2.0
Batch size
64
Epochs
60
Validation of the Ecuadorian plate format
Format validation has been a post-processing step. The CNN has labeled each box and read left to right, the labels have formed the plate string, checked against the Ecuadorian format of three letters and three or four digits [23]; readings that do not fit have been dropped. When extra boxes appear, the system has tried every combination that fits the format and has kept the one with the best score, which combines the average CNN confidence with the geometric consistency of the boxes, using two penalties set experimentally.
Speed estimation with virtual lines
Speed has been measured with two virtual lines on the frame, marking the entry and exit of the measurement zone: the time between the plate crossing the first and the second line is the crossing time. This places control points inside the video, with no extra sensors, which suits vision-based systems where the crossing is tied to a real distance in the scene [8]. The plate, not the whole vehicle, has been tracked to reduce the computational load. The lines have been about 5 m apart, measured during calibration and treated as an experimental value, and the speed has been computed from that distance and the crossing time, as in tracking and timestamp methods [8].
Mamdani fuzzy inference system
The decision module has taken two inputs, the speeding and the plate's repeat offenses, and has returned a severity value with a Mamdani fuzzy system, chosen for its readable If-Then rules over Takagi-Sugeno schemes [9]. Speeding is the gap from a 20 km/h zone limit; the recidivism is the number of times that plate has exceeded the limit, and it raises the severity only when there is speeding, since a prior offender is more likely to repeat [10]. Each variable uses membership functions between 0 and 1 [24], with the shapes in Table 9, which are simple yet effective [25].
Table 9. Fuzzy variables of the implemented fuzzy system.
no action, warning, low suspension, medium, high, and critical
trap(0,0,5,15),
tri(10,20,30),
tri(25,40,55),
tri(50,65,80),
tri(75,85,95),
trap(90,96,100,100)
The If-Then rules link the speeding and the repeat offenses to a severity level. Following the Mamdani method [26], the active rules have been joined and the resulting fuzzy region turned into a single value; here, maximum aggregation and centroid defuzzification were chosen experimentally, giving a severity value from 0 to 100.
Monitoring App
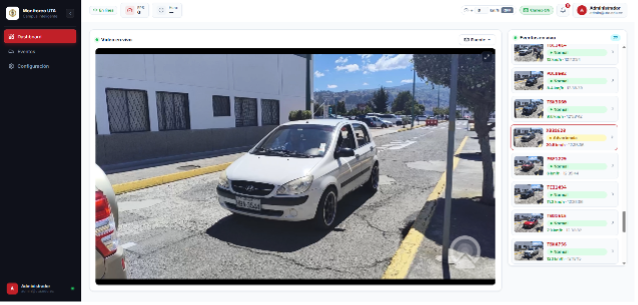
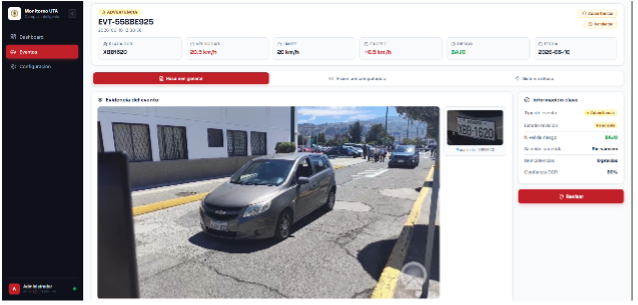
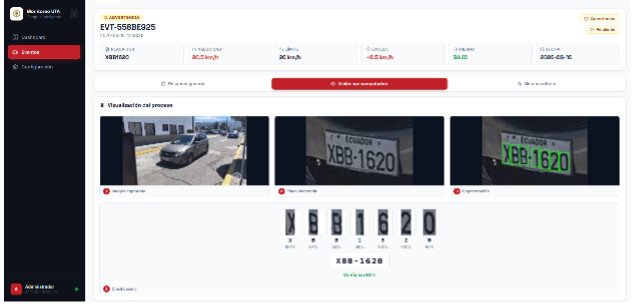
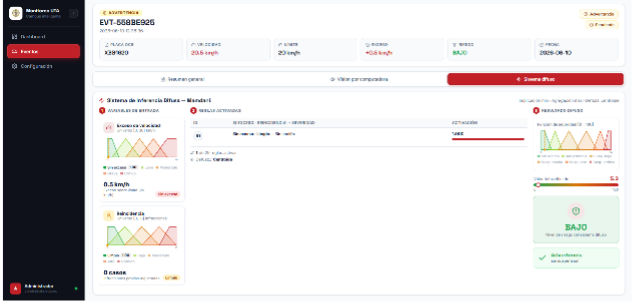
The previous stages have been integrated into a web monitoring application that runs the flow on the live video and displays, for each vehicle, the plate, the estimated speed, the risk level, and the suggested penalty, along with a step-by-step view of the process and the details of the fuzzy system (Figure 5).
(a)
(b)
(c)
(d)
Figure 5. Interface of the monitoring application: (a) main panel with live video and events; (b) event summary; (c) computer vision with the step-by-step process; (d) output of the Mamdani fuzzy system.
Each processed vehicle has generated an event saved in an internal database, so the records have remained available for later review and for evaluation.
Experimental evaluation protocol
Evaluation of the individual models. Each model has been tested individually before integration, starting with the detector since its output shapes the later steps. The YOLOv11n detector, trained from scratch with a single class and a 416 px input, has been tested on the test set with precision, recall, and mAP50, the same metrics recent YOLOv11 plate-detection studies report to compare variants [4]. The U-Net has not been tested independently, since the datasets lacked a proper test set with reference masks (Table 3); it has been assessed within the integrated flow, where the quality of the crops directly affects the classifier.
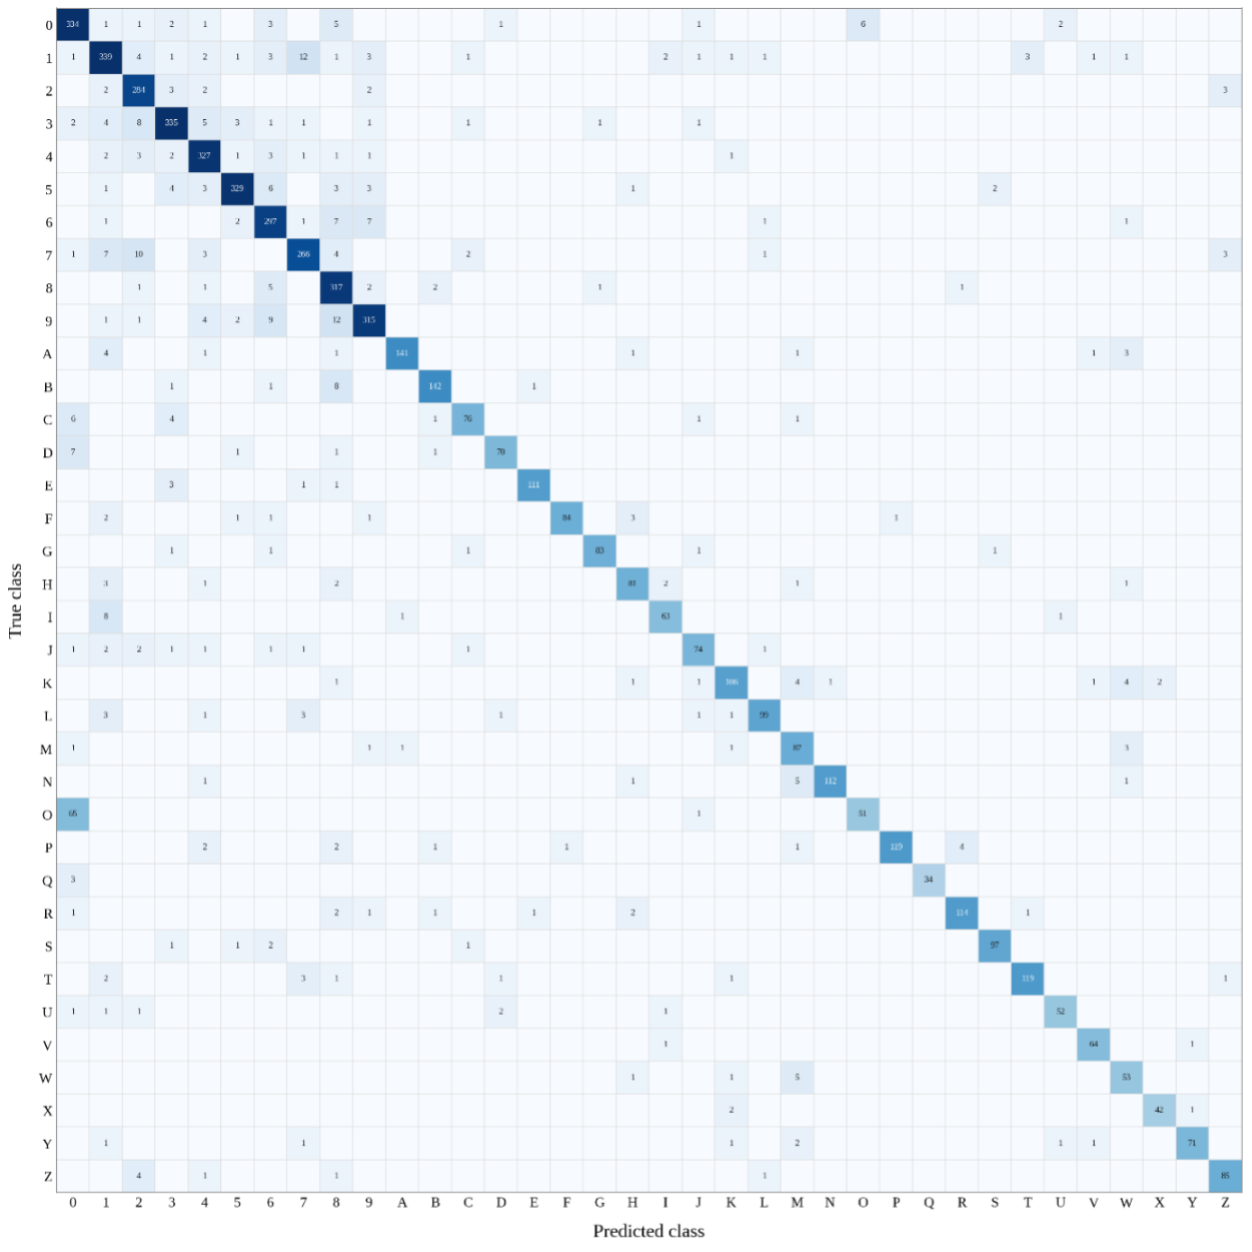
The CNN classifier has been evaluated on a character test set kept separate from training, using a 36-class setup with digits 0-9 and letters A-Z. Performance is summarized through overall accuracy and a confusion matrix. Accuracy gives the proportion of correctly read characters, while the matrix highlights confusions between true and predicted classes, especially visually similar pairs such as O/0, B/8, and I/1. These errors may later affect full-plate reading [27].
Evaluation of the integrated system. The complete system has been tested with real vehicles leaving the Complejo Deportivo Acuático of the Universidad Técnica de Ambato, a site where the camera could be installed and the measurement zone defined with virtual lines. Because the total number of vehicles passing through this point was not fixed, the sample size has been estimated using the standard proportion formula for unknown or very large populations [28]:
$$ n=\frac{Z_\alpha^2\cdot p\cdot q}{i^2} $$
(2)
where Z is the critical value of the confidence level, \(p\) the expected success proportion, \(q=1-p\), and \(i\) the allowed margin of error. Under a conservative criterion \((q=p=0.5\), which maximizes the sample size), a 90% confidence level, and a margin of error of \(\pm9.56, n\approx74\) has been obtained. The evaluation has included those 74 vehicles whose plate was visible and whose reading the system could produce, and the cases with a non-visible plate or without enough reference to verify the plate have been excluded.
For each vehicle, the real plate, verified manually on the image, has been compared with the plate predicted by the system. A reading has counted as correct only when the whole plate matched exactly, so any missing, wrong, or extra character has counted as an error, even if the rest was right. The average classifier confidence has also been recorded, per plate and per character type, to identify where recognition is least reliable.
4. Results
4.1. Performance of the individual models
On the test partition, the YOLOv11n plate detector has obtained a precision of 98.80%, a sensitivity of 93.46%, and an mAP50 of 96.13% (Table 10).
Table 10. Métricas del detector de placas YOLOv11n sobre la partición de prueba.
Metric
Value
Precisión
98.8%
Recall
93.46%
mAP50
96.13%
The segmentation U-Net has not been evaluated in isolation; its results are reported within the integrated system. The CNN classifier has been evaluated on 5877 crops from the test set, with a global accuracy of 91.42% and 504 misclassified characters. The confusion matrix is shown in Figure 6.
Figure 6. Confusion matrix of the character classifier on the test set.
4.2. Performance of the integrated system
Global performance. The evaluation has been performed on 74 vehicles. The system has reached an accuracy of 94.59% in reading the full plate, with an average classifier confidence of 92.89%. The summary is presented in Table 11.
Table 11. Global performance of the integrated system.
Indicator
Value
Vehicles evaluated
74
Correct readings
70
Incorrect readings
4
Accuracy
94.59%
Error
5.41%
Average classifier confidence
92.89%
Performance by character type. For each predicted character, Table 12 reports the number of occurrences and the average confidence. The 74 vehicles have given a total of 510 character occurrences; of the 36 possible characters, the classifier has produced 33, and Q, U, and Y did not appear (marked with a dash in the table).
Table 12. Classifier confidence by predicted character type (sample of 74 vehicles).
Type
No. of occurrences
Average confidence
0
19
62.37%
1
35
94.52%
2
38
99.20%
3
29
99.96%
4
37
97.11%
5
28
99.35%
6
31
99.15%
7
24
92.52%
8
23
94.46%
9
24
98.10%
A
6
99.83%
B
57
91.01%
C
7
94.46%
D
9
70.94%
E
4
87.95%
F
3
90.91%
G
1
95.26%
H
8
96.47%
I
7
82.10%
J
8
88.20%
K
10
95.70%
L
9
96.16%
M
3
96.32%
N
1
98.13%
O
6
29.12%
P
19
92.70%
Q
-
-
R
1
99.45%
S
2
97.00%
T
53
97.75%
U
-
-
V
3
80.56%
W
2
48.89%
X
2
99.31%
Y
-
-
Z
1
76.18%
5. Discussion
The results support the research assumption: joining detection, segmentation, classification, format validation, speed estimation, and fuzzy inference into a single flow has recognized the plates and has generated a gradual, readable suggested penalty, tested on 74 real vehicles.
The detector has reached an mAP50 of 96.13% (98.80% precision, 93.46% sensitivity), so almost all regions marked as plates were genuine plates and very few were missed, which has given the later stages valid crops. On those crops, the classifier has obtained 91.42% accuracy, with the errors concentrated in similar-shaped pairs, especially O and 0, as the confusion matrix shows. The full plate reading has then reached 94.59% (about nineteen of every twenty vehicles read without error, under a strict rule where one wrong character invalidates the whole plate), which shows that the per-character performance remained high and the models integrated well.
The average confidence by character type supports this. Most characters have been recognized with high confidence, above 95% for many digits and letters, while the lowest values belong to the ambiguously shaped characters: the digit 0 (62.37%), the letter O (29.12%), and the W (48.89%). Confidence thus indicates where uncertainty concentrates, matching the conflicting pairs in the confusion matrix; some characters appeared very few times, so their average is less reliable.
Based on the recognized plate, the Mamdani module has delivered a severity level and a suggested penalty that the operator can read. Together, these results show that the system is reliable enough for objective decision support, while human review remains for the small number of incorrect readings, and they fill the gap noted in the introduction: linking visual perception with decision support instead of only identifying the plate.
Multi-stage ALPR systems with real-time inference reach high detection and recognition accuracy but mainly aim to identify the plate [2]; some connect this with parking dashboards, without the speed or the vehicle's behavior [3], and others join detection and OCR to read the plate, also reaching only recognition [7]. This work instead extends the flow to the speed and the plate's history to produce a decision. The lightweight YOLO variant suits real-time use [4] and limited-resource hardware [11]; CNN recognition agrees with the results reported for plate characters [6]; the Mamdani choice is based on its readability compared with Takagi-Sugeno schemes [9]; and using recidivism as an aggravating factor agrees with the documented link between past offenses and driving risk [10].
The main implication is that the proposed system can turn raw measurements into a clear recommendation using general-purpose hardware in a limited institutional setting. The operator remains responsible for the final decision. The fuzzy layer makes the output easier to interpret than a rigid threshold, which supports its use as a decision-support tool.
The study has limitations. The evaluation has been limited to a single scenario, one day, and 74 low-speed vehicles, so the results cannot be generalized without further testing. Speed has been verified in only one case (18.8 vs. 20 km/h), recidivism data has come from an internal database rather than official records, and several parameters have been set empirically. Most errors have involved similar characters, especially O and 0; Q, U, and Y have not appeared, and the U-Net has not been evaluated separately.
Future work should validate speed with more reference measurements, expand data capture across days, scenarios, and speed ranges, include less frequent characters, refine the fuzzy parameters, and integrate official recidivism records.
Conclusions
This work has developed and evaluated a computer vision system that integrates YOLOv11n plate detection, U-Net character segmentation, CNN classification, Ecuadorian plate-format validation, speed estimation with virtual lines, and a Mamdani fuzzy system for speeding and recidivism. On 74 real vehicles, the system has achieved 94.59% full-plate accuracy and has produced a clear suggested penalty. This supports its use as a decision-support tool without replacing the operator’s judgment. The results show that the integrated system is feasible in a limited institutional setting and can help monitor vehicles, not only read plates.
Acknowledgments
This research has been carried out by the authors, affiliated with the Universidad Técnica de Ambato, with their own resources and did not receive external funding.
Author Contributions
Fernando Bonilla-Guerrero
Josué García-Abata
Rubén Nogales
Conceptualizacion
Formal analysis
Investigation
Methodology
Resources
Validation
Writing – review and editing
References
[1] E. Dilek and M. Dener, "Computer vision applications in intelligent transportation systems: A survey," Sensors, vol. 23, no. 6, p. 2938, 2023, doi: 10.3390/s23062938.
[2] A. Ammar, A. Koubaa, W. Boulila, B. Benjdira and Y. Alhabashi, "A multi-stage deep-learning-based vehicle and license plate recognition system with real-time edge inference," Sensors, vol. 23, no. 4, p. 2120, 2023, doi: 10.3390/s23042120.
[3] M. Safran, A. Alajmi and S. Alfarhood, "Efficient multistage license plate detection and recognition using YOLOv8 and CNN for smart parking systems," Journal of Sensors, vol. 2024, p. 4917097, 2024, doi: 10.1155/2024/4917097.
[4] Sutikno, A. Sugiharto and R. Kusumaningrum, "Enhanced automatic license plate detection and recognition using CLAHE and YOLOv11 for seat belt compliance detection," Engineering, Technology & Applied Science Research, vol. 15, no. 1, pp. 20271-20278, 2025, doi: 10.48084/etasr.9629.
[5] R. J. Tom, A. Kumar, S. Shaik, L. D. Isaac, V. Tripathi and P. Pareek, "Car license plate detection and recognition using modified U-Net deep learning model," in 8th International Conference on Smart Structures and Systems (ICSSS), 2022, doi: 10.1109/ICSSS54381.2022.9782176.
[6] M. Salemdeeb and S. Ertürk, "Full depth CNN classifier for handwritten and license plate characters recognition," PeerJ Computer Science, vol. 7, p. e576, doi: 10.7717/peerj-cs.576.
[7] H. Moussaoui, N. El Akkad, M. Benslimane, W. El-Shafai, A. Baihan , C. Hewage and R. S. Rathore , "Enhancing automated vehicle identification by integrating YOLO v8 and OCR techniques for high-precision license plate detection and recognition," Scientific Reports, vol. 14, p. 14389, 2024, doi: 10.1038/s41598-024-65272-1.
[8] R. Li, "A multi-stage deep learning approach for real-time vehicle detection, tracking, and speed measurement in intelligent transportation systems," Scientific Reports, vol. 15, p. 22531, 2025, doi: 10.1038/s41598-025-07343-5.
[9] M.-D. Pop , D. Pescaru and M. V. Micea , "Mamdani vs. Takagi-Sugeno fuzzy inference systems in the calibration of continuous-time car-following models," Sensors, vol. 23, no. 21, p. 8791, 2023, doi: 10.3390/s23218791.
[10] A. Kaur , J. Williams , R. Recker , D. Rose , M. Zhu and J. Yang , "Subsequent risky driving behaviors, recidivism and crashes among drivers with a traffic violation: A scoping review," Accident Analysis & Prevention, vol. 192, p. 107234, 2023, doi: 10.1016/j.aap.2023.107234.
[11] B. Satya , D. Manongga , Hendry and A. Aminuddin , "Optimized YOLOv8 for automatic license plate recognition on resource constrained devices," Engineering, Technology & Applied Science Research, vol. 15, no. 2, pp. 21976-21981, 2025, doi: 10.48084/etasr.9983.
[18] International Electrotechnical Commission (IEC), "IEC 62676-4: Video surveillance systems for use in security applications — Part 4: Application guidelines," IEC, 2014.
[19] "Communication in the presence of noise," Proceedings of the IRE, vol. 37, no. 1, pp. 10-21, 1949, doi: 10.1109/JRPROC.1949.232969.
[20] O. Ronneberger , P. Fischer and T. Brox , "U-Net: Convolutional networks for biomedical image segmentation," in Medical Image Computing and Computer-Assisted Intervention (MICCAI 2015), Lecture Notes in Computer Science, vol. 9351, 2015, doi: 10.1007/978-3-319-24574-4_28.
[21] K. Simonyan and A. Zisserman , "Very deep convolutional networks for large-scale image recognition," in International Conference on Learning Representations (ICLR), 2015, doi: 10.48550/arXiv.1409.1556.
[22] N. Srivastava , G. Hinton , A. Krizhevsky , I. Sutskever and R. Salakhutdinov , "Dropout: A simple way to prevent neural networks from overfitting," Journal of Machine Learning Research, vol. 15, no. 1, pp. 1929-1958, 2014.
[23] Consultas Ecuador, "Placas de Autos en Ecuador," 2023. [Online]. Available: https://consultasecuador.com/blog/ver/placas-de-autos-en-ecuador.
[24] L. A. Zadeh, "Fuzzy sets," Information and Control, vol. 8, no. 3, pp. 338-353, 1965, doi: 10.1016/S0019-9958(65)90241-X.
[25] V. Kreinovich , O. Kosheleva and S. N. Shahbazova , "Why triangular and trapezoid membership functions: A simple explanation," in Recent Developments in Fuzzy Logic and Fuzzy Sets (Studies in Fuzziness and Soft Computing, vol. 391), Springer, 2020, pp. 25-31, doi: 10.1007/978-3-030-38893-5_2.
[26] S. Assilian and E. H. Mamdani, "An experiment in linguistic synthesis with a fuzzy logic controller," International Journal of Man-Machine Studies, vol. 7, no. 1, pp. 1-13, 1975, doi: 10.1016/S0020-7373(75)80002-2.
[27] O. Rainio , J. Teuho and R. Klén , "Evaluation metrics and statistical tests for machine learning," Scientific Reports, vol. 14, p. 6086, 2024, doi: 10.1038/s41598-024-56706-x.
[28] W. G. Cochran, Sampling Techniques, New York: John Wiley & Sons, 1977.
[29] T.-Y. Lin, P. Goyal , R. Girshick , K. He and P. Dollár , "Focal loss for dense object detection," in Proceedings of the IEEE International Conference on Computer Vision (ICCV), 2017, doi: 10.1109/ICCV.2017.324.
Pontificia Universidad Católica del Ecuador - Sede Ambato


 ,
Josué García-Abataa
,
Josué García-Abataa